Click on a correlation number in the correlation table to display a correlation historical chart.
Tip: To chart all correlations related to a position, click on the symbol name (the column header or row header) in the correlation table.
The chart shows how correlations evolved over time. For example in the chart below, the RMT/LRIOX correlation was much higher 10 years back. Its current value (corresponding to the rightmost point in the chart) is much lower than historical.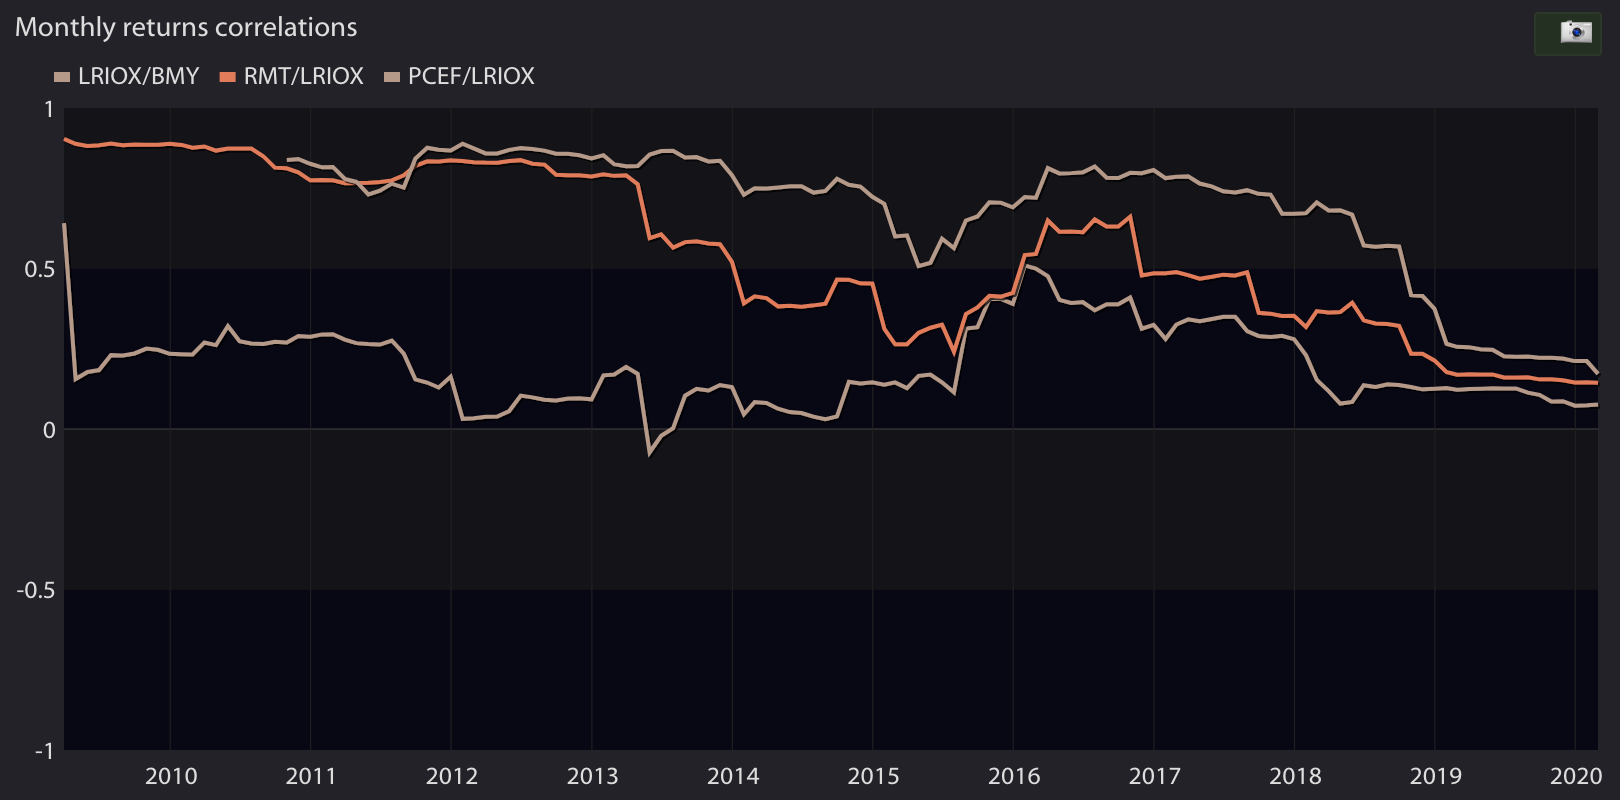
To remove a correlation from the chart, you can either:
- click on its location in the correlation table
- click on a correlation table header
- click on "Clear" button next to the chart
- click on "Symbol" cell at the top left of the correlation table